While the Cubs dropped two of three to the Rangers, it’s hard to be too terribly upset with their performance recently. After all, they are 20-5 over their last 25 games, including two 10-game winning streaks and an active 15-game winning streak at Wrigley Field. All of these streaks are historic. The last time the Cubs had multiple ten-game winning streaks in a season or a home winning streak longer than 15 was 1935, a season where they went 100-54 before losing the World Series 4-2 to the Detroit Tigers.
Starting a new winning streak won’t be easy, however. The Cubs will take their 27-14 record into Truist Park in Atlanta for a three-game set that begins on Tuesday where they’ll take on the only team in the National League with a better record. The Braves have opened the 2026 season with a 28-13 record.
A quick look at the team hitting leaderboards at Fangraphs shows that the Cubs and Braves have both gotten off to hot starts offensively this season:
Team
TG
PA
HR
R
RBI
SB
BB%
K%
ISO
BABIP
AVG
OBP
SLG
wOBA
xwOBA
wRC+
WAR
CHC
41
1621
51
215
198
27
11.78%
20.23%
.165
.292
.252
.347
.417
.341
.335
119
9.8
LAD
40
1535
53
203
191
20
10.23%
20.85%
.169
.308
.265
.344
.434
.345
.353
120
9.2
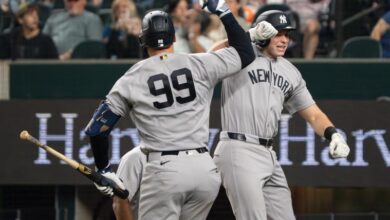
NYY
41
1552
63
215
204
40
11.98%
23.39%
.203
.278
.239
.333
.442
.342
.350
117
9.2
ATL
41
1574
57
228
223
21
8.20%
20.52%
.179
.310
.270
.334
.450
.346
.341
120
9.0
HOU
41
1573
52
196
186
15
9.22%
20.34%
.172
.297
.258
.333
.429
.337
.337
113
7.1
PIT
41
1632
44
206
199
38
10.54%
23.22%
.142
.307
.249
.337
.391
.327
.328
105
6.2
STL
40
1535
46
186
180
30
9.25%
21.95%
.152
.277
.235
.318
.388
.316
.325
102
5.8
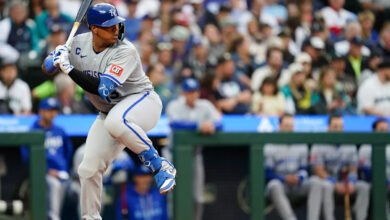
KCR
41
1533
41
169
162
29
9.52%
22.18%
.150
.288
.241
.319
.391
.317
.316
96
5.2
ATH
40
1545
44
176
173
24
9.71%
22.78%
.151
.302
.249
.326
.400
.324
.322
100
5.1
WSN
41
1586
44
217
203
41
9.46%
21.94%
.157
.290
.242
.323
.399
.322
.327
104
5.1
MIA
41
1537
32
176
166
48
9.24%
21.73%
.131
.303
.248
.327
.378
.318
.309
100
4.9
CHW
40
1527
51
171
161
28
10.09%
24.49%
.160
.280
.231
.322
.391
.319
.329
100
4.7
MIN
41
1575
45
194
184
32
10.03%
22.73%
.146
.286
.237
.325
.383
.319
.315
100
4.6
SEA
41
1545
46
167
162
30
10.23%
24.53%
.148
.282
.229
.319
.378
.315
.326
104
4.5
TOR
40
1498
37
164
158
14
7.61%
17.96%
.130
.285
.251
.313
.381
.310
.311
94
4.4
CLE
42
1584
40
173
165
41
10.98%
20.14%
.138
.269
.230
.321
.368
.311
.315
96
4.3
BAL
41
1545
42
181
178
19
10.81%
24.47%
.151
.290
.232
.319
.383
.317
.320
100
4.2
BOS
40
1508
29
156
149
32
8.75%
22.41%
.119
.291
.235
.314
.353
.303
.310
85
4.1
SDP
40
1470
39
170
163
40
8.91%
22.65%
.147
.266
.223
.297
.370
.298
.320
92
3.9
MIL
38
1479
26
195
187
40
11.70%
20.42%
.114
.293
.240
.333
.353
.311
.315
97
3.8
LAA
41
1561
50
177
170
24
9.87%
25.43%
.156
.288
.233
.321
.389
.319
.318
99
3.7
DET
41
1544
37
175
166
17
10.17%
22.09%
.148
.295
.242
.325
.391
.322
.339
102
3.6
ARI
39
1424
36
169
163
18
7.72%
21.77%
.155
.282
.236
.299
.392
.308
.305
93
3.5
TEX
40
1495
37
149
142
19
9.90%
23.41%
.136
.288
.234
.316
.370
.309
.316
95
3.4
PHI
41
1551
49
170
167
23
7.87%
20.95%
.160
.272
.237
.303
.396
.312
.316
95
3.3
TBR
39
1473
32
171
160
40
8.62%
18.60%
.118
.298
.254
.327
.373
.315
.305
97
3.2
CIN
41
1542
53
164
153
34
10.38%
24.51%
.162
.262
.219
.305
.381
.309
.333
90
2.6
COL
41
1554
41
175
170
35
8.04%
25.80%
.148
.321
.250
.320
.399
.322
.307
90
2.4
SFG
40
1455
26
130
125
10
5.50%
21.51%
.120
.295
.242
.287
.362
.289
.291
84
1.2
NYM
40
1474
31
139
132
19
8.01%
20.96%
.119
.264
.222
.287
.341
.283
.311
81
0.5
I sorted this table by fWAR which shows the Cubs leading all of MLB heading into this week’s series with the Braves. However, if you sort by different categories the Cubs generally rank between first and fifth with the Braves right in the same mix. For example, by wRC+ the top three teams are the Dodgers, Braves and Cubs. By OBP the top teams are the Cubs, Dodgers, Pirates and Braves. This should be a great matchup.
While season-long numbers are preferable for larger sample sizes and and stability, who’s hot at a given moment could impact a specific series outcome more. To that end, I’ve run tables for each teams batters over the last two weeks. I’ve limited it to players with at least 20 plate appearances during that time. First up, the Cubs:
Name
G
PA
HR
R
RBI
SB
BB%
K%
ISO
BABIP
AVG
OBP
SLG
wOBA
xwOBA
wRC+
Michael Conforto
8
23
2
6
3
0
13.04%
13.04%
.500
.400
.400
.478
.900
.575
.506
278
Michael Busch
13
58
1
4
12
1
20.69%
22.41%
.205
.387
.295
.448
.500
.420
.386
172
Seiya Suzuki
11
49
3
8
8
0
16.33%
22.45%
.275
.296
.275
.388
.550
.393
.369
154
Pete Crow-Armstrong
13
52
3
8
10
4
9.62%
15.38%
.283
.257
.261
.346
.543
.387
.404
150
Ian Happ
13
57
2
13
4
1
21.05%
31.58%
.227
.333
.227
.404
.455
.381
.411
146
Matt Shaw
10
22
1
3
1
0
0.00%
13.64%
.182
.222
.227
.227
.409
.276
.214
74
Nico Hoerner
12
54
0
4
5
1
7.41%
3.70%
.104
.213
.208
.278
.313
.268
.330
69
Dansby Swanson
12
43
0
4
4
2
6.98%
9.30%
.050
.250
.225
.279
.275
.255
.316
60
Alex Bregman
12
52
0
8
3
0
15.38%
21.15%
.045
.242
.182
.308
.227
.253
.327
59
Carson Kelly
8
31
0
3
3
0
6.45%
16.13%
.000
.250
.207
.258
.207
.220
.209
36
Moisés Ballesteros
12
45
2
3
7
0
8.89%
17.78%
.150
.032
.075
.156
.225
.176
.282
6
A few things jump out immediately. First of all, Michael Conforto is on quite the hot streak, and I imagine Craig Counsell will try to ride that hot streak as long as he can, especially given the struggles of his other designated hitter against righties, Moisés Ballesteros. However, looking more closely at Ballesteros’ numbers, he really looks like he’s gotten unlucky during this two-week stretch. He’s still striking out less than 18 percent of the time and walking at a decent clip. An .032 BABIP might be the worst BABIP I’ve ever seen in a stretch of 45 plate appearances. Combine it with the fact that he’s had a 33.3 percent hard hit rate during that stretch with a healthy 15.2 percent barrel rate, and that seems like a slump Ballesteros should break out of any moment.
Additionally, both Seiya Suzuki and Michael Busch seem to have broken out of their early season slumps and have been on a a bit of a tear. Busch is slashing .295/.448/.500 with a wRC+ of 172 and a home run over his last 58 plate appearances. Seiya is slashing .275/.388/.550 with a wRC+ of 154 with three home runs over his last 49 plate appearances. The good news is that aside from a .400 BABIP and .500 ISO from Conforto and a slightly overheated .387 BABIP from Busch, the only thing that looks unsustainable in this table is the bad luck some hitters have been experiencing.
Turning to the Braves offense:
Name
G
PA
HR
R
RBI
SB
BB%
K%
ISO
BABIP
AVG
OBP
SLG
wOBA
xwOBA
wRC+
Matt Olson
12
52
6
11
11
1
13.46%
25.00%
.477
.269
.295
.385
.773
.475
.461
207
Ronald Acuña Jr.
5
20
0
3
1
1
10.00%
30.00%
.167
.500
.333
.400
.500
.398
.338
155
Ozzie Albies
12
53
3
11
9
0
11.32%
13.21%
.261
.270
.283
.358
.543
.390
.328
149
Drake Baldwin
12
54
3
6
7
0
12.96%
24.07%
.217
.300
.261
.370
.478
.372
.374
138
Jorge Mateo
11
28
1
6
3
2
3.57%
25.00%
.148
.421
.333
.357
.481
.371
.323
137
Eli White
10
24
0
3
4
1
4.17%
25.00%
.087
.412
.304
.333
.391
.322
.293
104
Mauricio Dubón
12
51
0
4
9
0
9.80%
13.73%
.111
.289
.244
.333
.356
.314
.333
98
Michael Harris II
11
35
1
4
3
0
0.00%
22.86%
.114
.346
.286
.286
.400
.302
.298
90
Austin Riley
12
48
2
6
7
1
4.17%
43.75%
.156
.348
.222
.250
.378
.275
.250
71
Mike Yastrzemski
12
31
0
4
1
0
0.00%
19.35%
.033
.292
.233
.258
.267
.240
.295
47
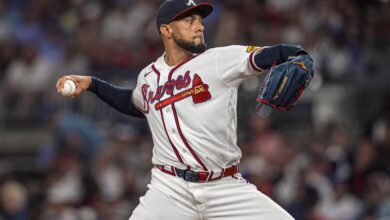
A big note at the top, the Braves’ best player, outfielder Ronald Acuña Jr. is currently on the injured list with a strained hamstring, so the Cubs won’t have to deal with Acuña at the top of the lineup. They will have to deal with a red-hot Matt Olson and Cubs killer extraordinaire Ozzie Albies, however. Olson has six home runs in his last 52 plate appearances and is slashing .295/.385/.773 during that stretch. Albies has three home runs and a .283/.358/.543 slashline over the last two weeks. Finally, keep an eye on last year’s Rookie of the Year, Drake Baldwin. He’s also got three home runs to go with a .261/.370/.478 slashline in his last 54 plate appearances.
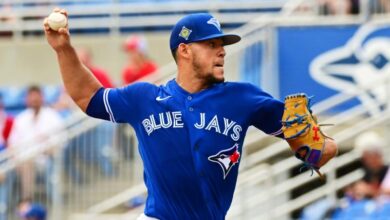
At the bottom of this chart, Mike Yastrzemski, Austin Riley and Michael Harris II are having the opposite experience of Ballesteros, riding relatively hot BABIPs for each of them to lackluster production. Yastrzemski is on the strong side of a platoon and unlikely to play when Shōta Imanaga takes the mound on Wednesday, however, Riley and Harris II are regulars who should be in the lineup for all three games against the Cubs.
This battle of offensive titans in the National League will be one to keep an eye on early this week. Here’s hoping the Cubs bats can stay hot in Atlanta